Archivo:Correlation examples2.svg
Ir a la navegación
Ir a la búsqueda

Tamaño de esta previsualización PNG del archivo SVG: 506 × 231 píxeles. Otras resoluciones: 320 × 146 píxeles | 640 × 292 píxeles | 1024 × 467 píxeles | 1280 × 584 píxeles | 2560 × 1169 píxeles.
Archivo original (archivo SVG, nominalmente 506 × 231 píxeles, tamaño de archivo: 2,18 MB)
Resumen
| Descripción |
English: redesign File:Correlation_examples.png using vector graphics (SVG file) |
| Fecha | |
| Fuente | Trabajo propio, original uploader was Imagecreator |
| Autor | DenisBoigelot, original uploader was Imagecreator |
| Permiso (Reutilización de este archivo) |
Released into the public domain (by the authors). |
| Otras versiones |
Obras derivadas de ésta: CovrarianceCorrelation.svg File:Correlation_examples.png |
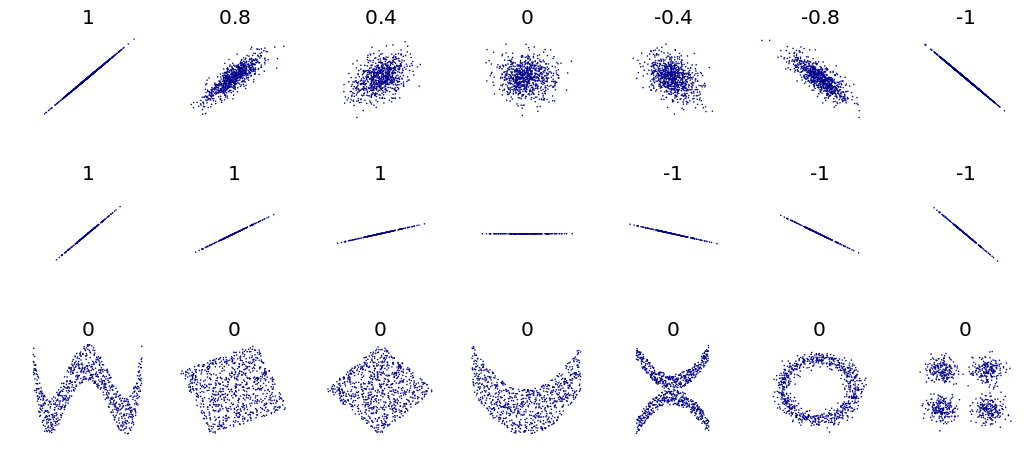
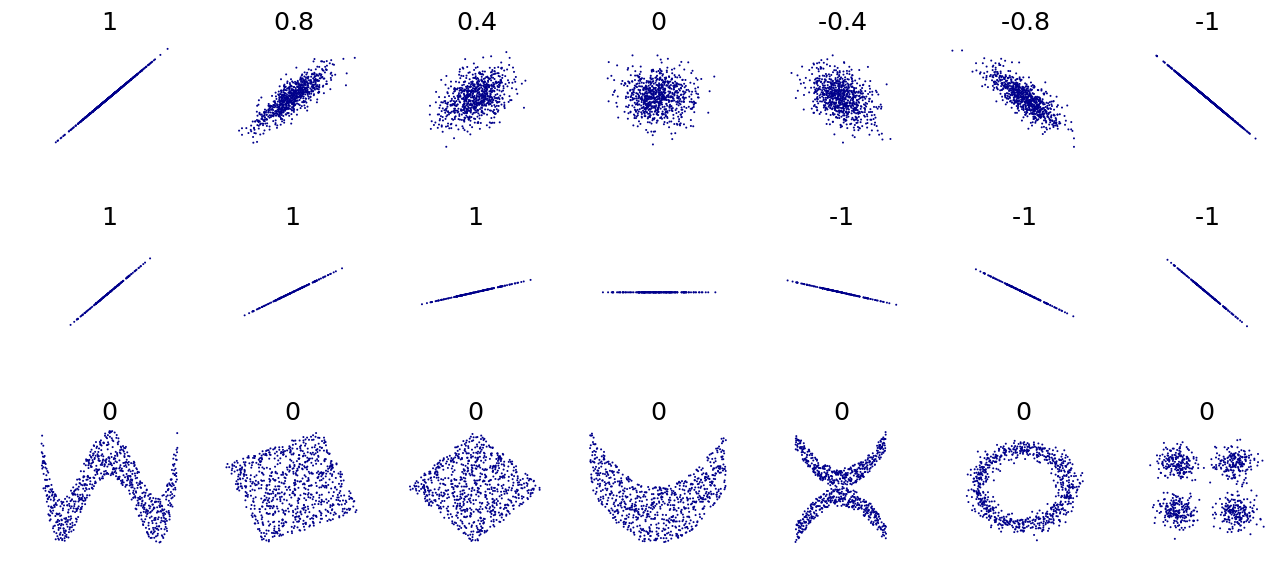
#Title: An example of the correlation of x and y for various distributions of (x,y) pairs
#Tags: Mathematics; Statistics; Correlation
#Author: Denis Boigelot
#Packets needed : mvtnorm (rmvnorm), RSVGTipsDevice (devSVGTips)
#How to use: output()
#
#This is an translated version in R of an Matematica 6 code by Imagecreator.

library(mvtnorm)
library(RSVGTipsDevice)

MyPlot <- function(xy, xlim = c(-4, 4), ylim = c(-4, 4), eps = 1e-15) {
   title = round(cor(xy[,1], xy[,2]), 1)
   if (sd(xy[,2]) < eps) title = "" # corr. coeff. is undefined
   plot(xy, main = title, xlab = "", ylab = "",
        col = "darkblue", pch = 16, cex = 0.2,
        xaxt = "n", yaxt = "n", bty = "n",
        xlim = xlim, ylim = ylim)
}

MvNormal <- function(n = 1000, cor = 0.8) {
   for (i in cor) {
      sd = matrix(c(1, i, i, 1), ncol = 2)
      x = rmvnorm(n, c(0, 0), sd)
      MyPlot(x)
   }
}

rotation <- function(t, X) return(X %*% matrix(c(cos(t), sin(t), -sin(t), cos(t)), ncol = 2))

RotNormal <- function(n = 1000, t = pi/2) {
   sd = matrix(c(1, 1, 1, 1), ncol = 2)
   x = rmvnorm(n, c(0, 0), sd)
   for (i in t)
      MyPlot(rotation(i, x))
}

Others <- function(n = 1000) {
   x = runif(n, -1, 1)
   y = 4 * (x^2 - 1/2)^2 + runif(n, -1, 1)/3
   MyPlot(cbind(x,y), xlim = c(-1, 1), ylim = c(-1/3, 1+1/3))

   y = runif(n, -1, 1)
   xy = rotation(-pi/8, cbind(x,y))
   lim = sqrt(2+sqrt(2)) / sqrt(2)
   MyPlot(xy, xlim = c(-lim, lim), ylim = c(-lim, lim))

   xy = rotation(-pi/8, xy)
   MyPlot(xy, xlim = c(-sqrt(2), sqrt(2)), ylim = c(-sqrt(2), sqrt(2)))

   y = 2*x^2 + runif(n, -1, 1)
   MyPlot(cbind(x,y), xlim = c(-1, 1), ylim = c(-1, 3))

   y = (x^2 + runif(n, 0, 1/2)) * sample(seq(-1, 1, 2), n, replace = TRUE)
   MyPlot(cbind(x,y), xlim = c(-1.5, 1.5), ylim = c(-1.5, 1.5))

   y = cos(x*pi) + rnorm(n, 0, 1/8)
   x = sin(x*pi) + rnorm(n, 0, 1/8)
   MyPlot(cbind(x,y), xlim = c(-1.5, 1.5), ylim = c(-1.5, 1.5))

   xy1 = rmvnorm(n/4, c( 3,  3))
   xy2 = rmvnorm(n/4, c(-3,  3))
   xy3 = rmvnorm(n/4, c(-3, -3))
   xy4 = rmvnorm(n/4, c( 3, -3))
   MyPlot(rbind(xy1, xy2, xy3, xy4), xlim = c(-3-4, 3+4), ylim = c(-3-4, 3+4))
}

output <- function() {
   devSVGTips(width = 7, height = 3.2) # remove first and last line for no svg exporting
   par(mfrow = c(3, 7), oma = c(0,0,0,0), mar=c(2,2,2,0))
   MvNormal(800, c(1.0, 0.8, 0.4, 0.0, -0.4, -0.8, -1.0));
   RotNormal(200, c(0, pi/12, pi/6, pi/4, pi/2-pi/6, pi/2-pi/12, pi/2));
   Others(800)
   dev.off() # remove first and last line for no svg exporting
}
Licencia
Yo, el titular de los derechos de autor de esta obra, la publico en los términos de la siguiente licencia:
| Este archivo está disponible bajo la licencia Dedicación de Dominio Público CC0 1.0 Dedicación a Dominio Público Universal de Creative Commons. | |
| La persona que ha asociado una obra a este documento lo dedica al dominio público mediante la cesión mundial de sus derechos bajo la ley de derechos de autor y todos los derechos legales adyacentes propios de dicha, en el ámbito permitido por ley. Puedes copiar, modificar, distribuir y reproducir el trabajo, incluso con objetivos comerciales, sin pedir aprobación del autor.
|
Historial del archivo
Haz clic sobre una fecha y hora para ver el archivo tal como apareció en ese momento.
| Fecha y hora | Miniatura | Dimensiones | Usuario | Comentario | |
|---|---|---|---|---|---|
| actual | 07:00 10 may 2011 | | 506 × 231 (2,18 MB) | wikimediacommons>DenisBoigelot | {{Information |Description ={{en|1=fd}} |Source ={{own}} |Author =DenisBoigelot |Date = |Permission = |other_versions = }} fjdk |
Usos del archivo
Las siguientes páginas usan este archivo: