Archivo:Milankovitch Variations.png
Ir a la navegación
Ir a la búsqueda
No disponible a mayor resolución.
Milankovitch_Variations.png (479 × 363 píxeles; tamaño de archivo: 32 kB; tipo MIME: image/png)
Resumen
| Descripción |
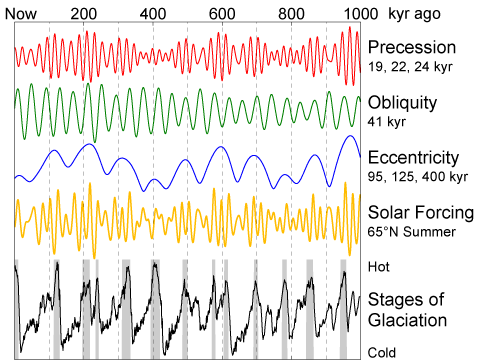
English: This figure shows the variations in Earth's orbit, the resulting changes in solar energy flux at high latitude, and the observed glacial cycles.
According to Milankovitch Theory, the precession of the equinoxes and the apsides, variations in the tilt of the Earth's axis (obliquity) and changes in the eccentricity of the Earth's orbit are responsible for causing the observed 100 kyr cycle in ice ages by varying the amount of sunlight received by the Earth at different times and locations, particularly high northern latitude summer. These changes in the Earth's orbit are the predictable consequence of interactions between the Earth, its moon, and the other planets. The orbital data shown are from Quinn et al. (1991). Principal frequencies for each of the three kinds of variations are labeled. The solar forcing curve (aka "insolation") is derived from July 1st sunlight at 65 °N latitude according to Jonathan Levine's insolation calculator [1]. The glacial data are from Lisiecki and Raymo (2005) and gray bars indicate interglacial periods, defined here as deviations in the 5 kyr average of at least 0.8 standard deviations above the mean. |
| Fecha | 11 de febrero de 2006 (fecha de carga) |
| Fuente | Trabajo propio |
| Autor | This image was produced by Robert A. Rohde from publicly available data, and is incorporated into the Global Warming Art project. |
| Otras versiones | Obras derivadas de ésta: Variacions de Milankovitch.png |
References
- Lisiecki, L. E., and M. E. Raymo (2005), "A Pliocene-Pleistocene stack of 57 globally distributed benthic δ18O records." Paleoceanography 20, PA1003, doi:10.1029/2004PA001071 (alternative full text link: [2][dead link]).
- Quinn, T. R., S. Tremaine, and M. Duncan (1991), "A Three Million Year Integration of the Earth's Orbit." The Astronomical Journal 101, pp. 2287-2305, doi:10.1086/115850.

|
Esta imagen debería volverse a crear como imágenes vectoriales SVG. Esto proporciona muchas ventajas, véase Commons:Media for cleanup (en inglés) para más información. Si ya hay una versión SVG de esta imagen disponible, por favor súbala a Commons. Tras subirla, reemplace esta plantilla con la plantilla
{{vector version available|nuevo nombre de imagen.svg}} en esta imagen. |
Licencia
Image from Global Warming Art
This image is an original work created for Global Warming Art. Please refer to the image description page for more information.

|
Se autoriza la copia, distribución y modificación de este documento bajo los términos de la licencia de documentación libre GNU, versión 1.2 o cualquier otra que posteriormente publique la Fundación para el Software Libre; sin secciones invariables, textos de portada, ni textos de contraportada. Se incluye una copia de la dicha licencia en la sección titulada Licencia de Documentación Libre GNU. |
| Este archivo se encuentra bajo la licencia Creative Commons Genérica de Atribución/Compartir-Igual 3.0. | ||
| ||
| Esta etiqueta de licencia fue agregada a este archivo como parte de la actualización de la licencia GFDL. |
Historial del archivo
Haz clic sobre una fecha y hora para ver el archivo tal como apareció en ese momento.
| Fecha y hora | Miniatura | Dimensiones | Usuario | Comentario | |
|---|---|---|---|---|---|
| actual | 12:35 11 feb 2006 | | 479 × 363 (32 kB) | wikimediacommons>David Legrand | == Description == This figure shows the variations in Earth's orbit, the resulting changes in solar energy flux at high latitude, and the observed glacial cycles. According to Milankovitch Theory, the precession of the [[ |
Usos del archivo
La siguiente página usa este archivo: